Stock Short Interest - Free : with Live Real Time Quote, Stock Chart, and Unlimited Watch-list
A handy tool to help you check the short interest of stocks trading in US markets. Easily view detailed short interest info. of each month and study the Short Interest Chart and Days to Cover Chart. All comes with Real-Time Advanced Stock Quotes (Pre and After market quotes included), Stock Charts with multiple Technical indicators, unlimited Watch-list, Powerful Multi Chart View, Charted Sector View, and so on.
Short interest (ratio) is widely used by both fundamental and technical traders to identify trend, for it represents the number of days it takes short sellers on average to repurchase all the borrowed shares.
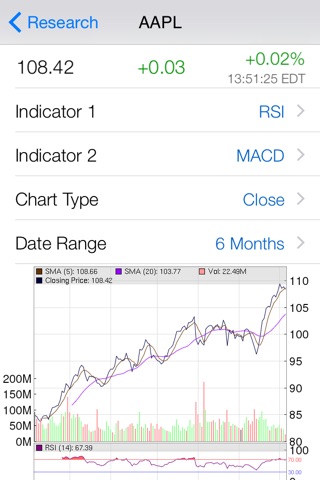
Simply enter a desired ticker symbol, you can conveniently view short interest, days to cover, settlement date, and average daily volume, all in a neatly organized table. A special Stock Research is right there for you. You can check the Real Time Advanced stock quotes like change, change %, bid, bid size, ask, ask size, open, high, low, close, and volume. Plus, study the stock chart and trend by analyzing 40+ technical indicators and adjusting chart type and date ranges. Adjust the parameters and enlarge the chart to full-screen for detailed study.
Additionally, create and manage unlimited watch-lists. The powerful watch-lists allow to group contents into Charted Sector View and exhibit a LIST of fully customized Charts (Multi-Chart View)! Create, modify, rename, sort, and delete watch-lists within seconds. Its so easy that you will love tracking stocks. Advance Stock Quotes with rich information are neatly presented to you, including bid price, big size, ask price, ask size, open, high, low, close, volume, etc. With one glance, not only can you get the whole picture your watch-list, but also view your stocks automatically grouped in sectors with weighted charts.
SHORT INTEREST
—————————
■ Settlement date
■ Short Interest
■ Days to Cover
■ Short Ratio (%)
■ Average Daily Share
■ Volume
■ Short Interest Chart
■ Days to Cover Chart
STOCK
—————
■ Real Time Advanced Quotes (bid, ask, bid size, ask size, open, high, low, close, volume, etc)
■ Pre and After market quotes
■ Auto refreshed quotes.
■ Multi Chart View
■ Sector view with chart
■ Symbol auto completion
■ Unlimited watch-list with colorful tags
CHART TYPE
———————
■ Candle Stick
■ Based on close price
■ OHLC (open, high, low, close)
■ Based on typical price
■ Based on weighted close price
■ Based on median price
TECHNICAL INDICATOR
————————————
■ Accumulation/Distribution
■ Aroon Oscillator / Up / Down
■ Avergage Directional Index / True Range
■ Bollinger Band Width
■ Chaikin Money Flow
■ Chaikin Oscillator / Volatility
■ Commodity Channel Index
■ Detrended Price Osc
■ Donchian Channel Width
■ Ease of Movement
■ Fast/Slow Stochastic
■ MACD
■ Mass Index
■ Momentum
■ Money Flow Index
■ On Balance Volume
■ Performance
■ % Price / Volume Oscillator
■ Pos/Neg Volume Index
■ Price Volume Trend
■ Rate of Change
■ RSI / StochRSI
■ TRIX
■ Ultimate Oscillator
■ Volume
■ Williams’s %R
DATE RANGE
———————
■ Past 5,4,3,2 day & current day.
■ Daily chart supports 1m, 2m, 6m, YTD, 1-5 years & MAX available date range.
■ Daily chart supports customized date range: choose any date range from the calendar.
You could communicate with us through the In-App messaging system or to [email protected].


